
-
-
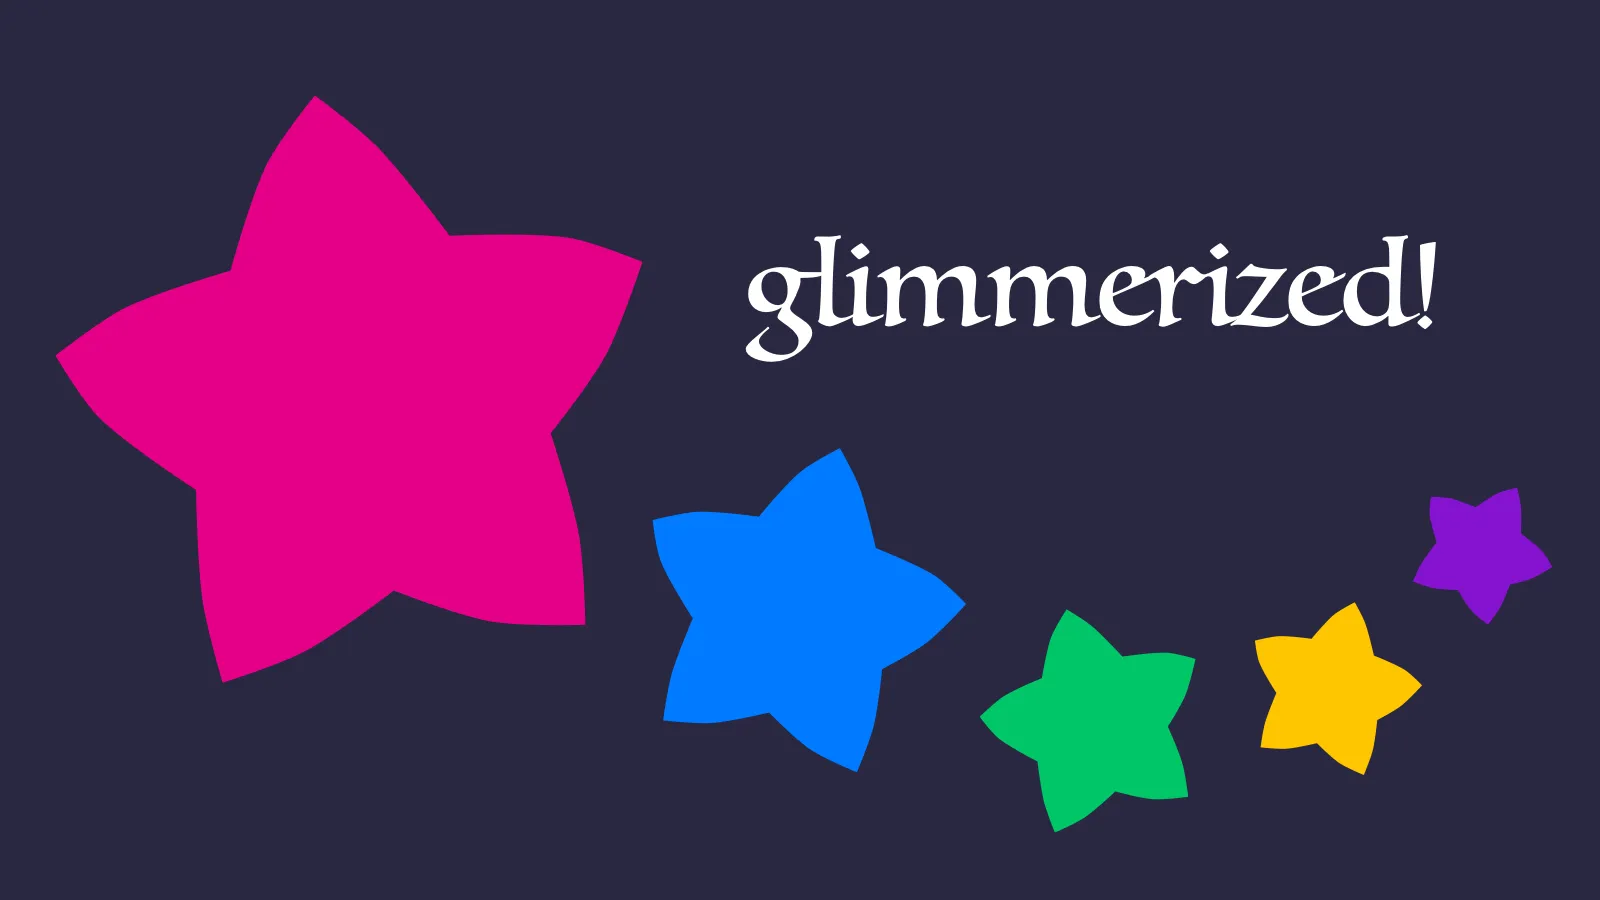
In stressful times, I sometimes cope by obsessing over finding the perfect colour palette. This has not necessarily been the healthiest of habits, but over the years I’ve converged on a delightful set of hues I’m happy to colour-code my life with.
I call the palette “Glimmerized”, and I’m publishing it here partly for my own future reference, and partly to discourage myself from tweaking it forever.
Glimmerized is based on five main colours: my favourite pink and blue, a purple in between, and a complementary green and yellow. The pink-green and blue-yellow combinations are inspired by opponent process colour theory and systems like NCS; I had those in mind when I created the Owl Beamer colour theme during another colour obsession phase a while back. But I didn’t attempt to choose perfectly opposing colours, lest I be tempted into deeper rabbit holes into the colour perception literature.
Instead, I chose a handful of colours I liked — with round coordinates in the OKLCH colour space — and built curves to let me generate any number of shades and tints of each hue.
R08 #e50088
oklch(0.6 0.25 355)
- R01
- R02
- R03
- R04
- R05
- R06
- R07
- R08
- R09
- R0a
- R0b
- R0c
- R0d
- R0e
- R0f
P08 #8613d1
oklch(0.5 0.25 305)
- P01
- P02
- P03
- P04
- P05
- P06
- P07
- P08
- P09
- P0a
- P0b
- P0c
- P0d
- P0e
- P0f
B08 #007aff
oklch(0.6 0.23 255)
- B01
- B02
- B03
- B04
- B05
- B06
- B07
- B08
- B09
- B0a
- B0b
- B0c
- B0d
- B0e
- B0f
G08 #00c669
oklch(0.7 0.23 160)
- G01
- G02
- G03
- G04
- G05
- G06
- G07
- G08
- G09
- G0a
- G0b
- G0c
- G0d
- G0e
- G0f
Y08 #ffc500
oklch(0.85 0.2 90)
- Y01
- Y02
- Y03
- Y04
- Y05
- Y06
- Y07
- Y08
- Y09
- Y0a
- Y0b
- Y0c
- Y0d
- Y0e
- Y0f
Glimmerized’s greyscale has a hint of purplish-blue to it.
K00 #0c061e
oklch(0.15 0.05 290)
- K00
- K01
- K02
- K03
- K04
- K05
- K06
- K07
- K08
- K09
- K0a
- K0b
- K0c
- K0d
- K0e
- K0f
- K10
Themes like Solarized, Dracula, and Fairyfloss taught me how nice it is to use colours you like when you spend all day looking at them. So I’m very happy to now use Glimmerized in my text editor, website, calendar, and to-do list — hopefully for a long time to come!
-
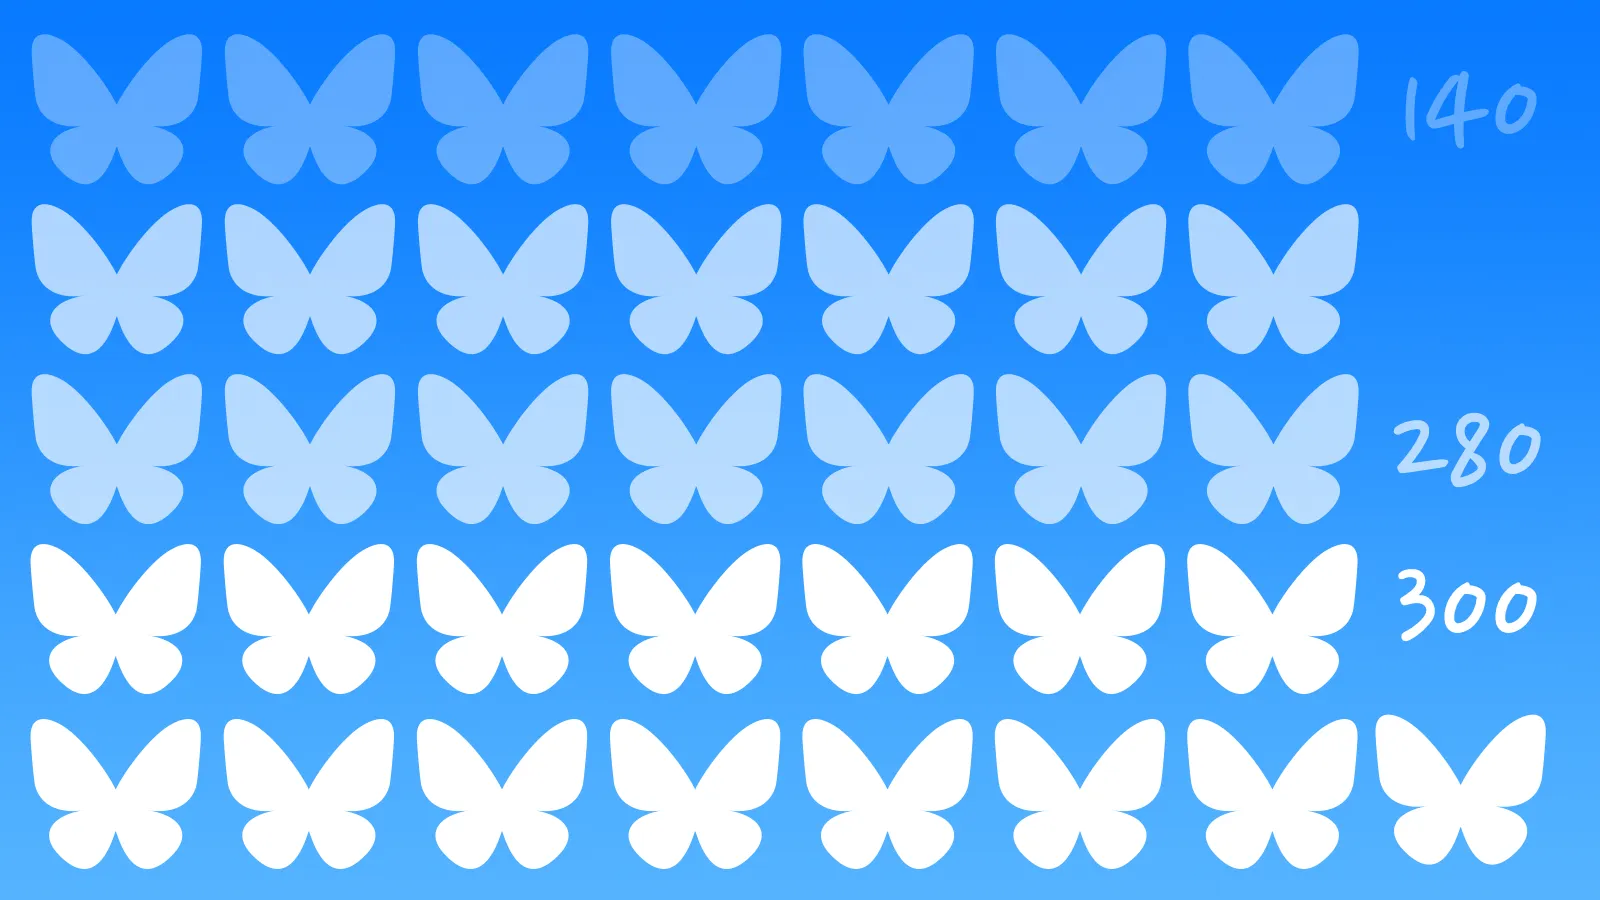
Ten years ago, I discovered that a disproportionate number of posts on Twitter had exactly 140 characters. Five years ago, I found the spike had shifted to the new 280-character limit. Now, Twitter has imploded and lots of people have migrated to Bluesky — what does the post length distribution look like on the new platform?
Length distribution of two million 2024 Bluesky posts, fit to an exponential curve.
Once again, we reproduce the spike approaching the character limit, with 300-character posts accounting for over half a percent of the entire dataset — more common than any other length greater than 50.
Once again, we also see the effects of bots: two bots are responsible for posting random strings of length 46 and 256 every few seconds, causing those lengths to be overrepresented.
But this might be my favourite of the charts I’ve made in this series. Take a close look at the 140 and 280 character marks: a larger-than-expected number of posts are exactly those lengths or slightly shorter. The curve abruptly reverts to its original course — an exponential decay curve — immediately after those milestones. That’s exactly the behaviour we expect (and observe!) when people compose posts that are a bit too long, then edit them down to fit within a character cap.
It’s entirely possible that these might be the exact same spikes we saw in my last two charts in this series, if people are reposting their old tweets from yesteryear on Bluesky. But I suspect this is more likely evidence of people crafting messages to be cross-posted to multiple platforms, in which case they may be using tools that recommend smaller limits than those supported by Bluesky. Time will tell what hypothesis is right!
-

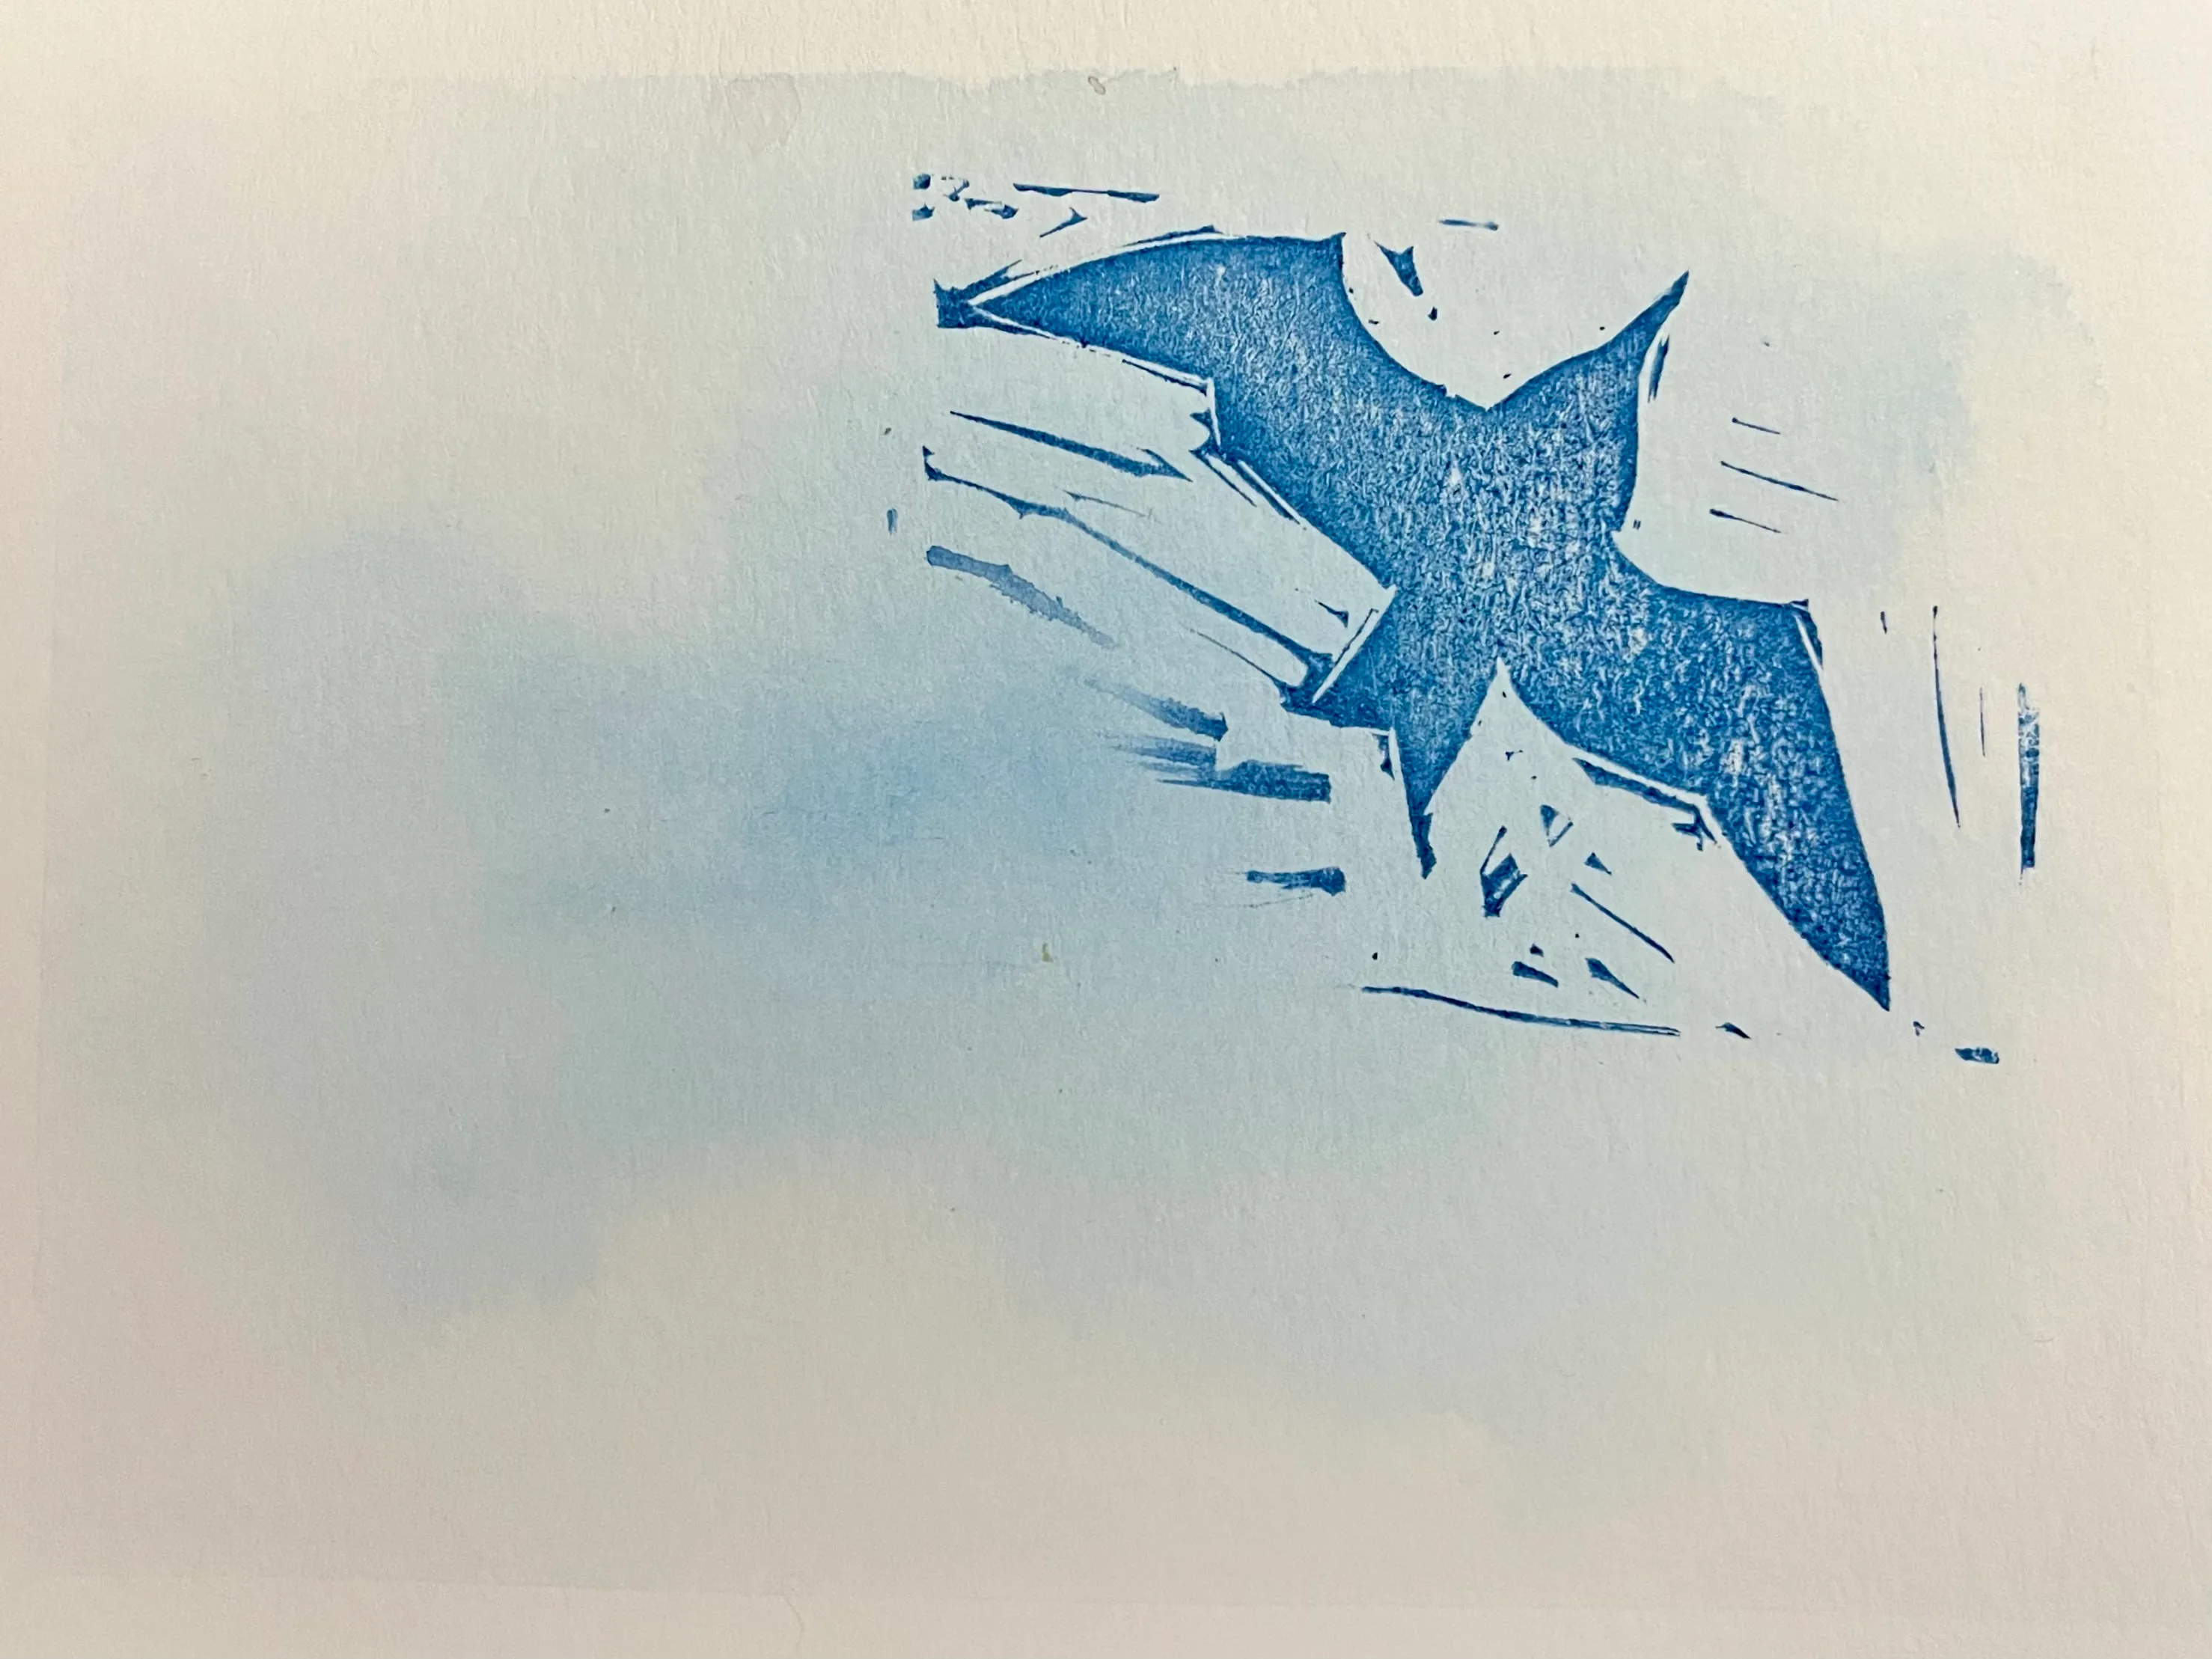
Today’s Unicode calligraphy highlights the International Phonetic Alphabet symbol for the glottal stop, the sound between the syllables of “uh-oh”. (It can also be heard if you say the phrase “glottal stop” in a Cockney accent!)
In Squamish orthography, the glottal stop is represented by the digit 7 instead of ʔ, as in Sḵwx̱wú7mesh.
-
Numbers like and are irrational. Are they called that because they are unreasonable? Or is it just because they just can’t be expressed as a ratio of two integers?
As it turns out, this question is even harder to answer in Ancient Greek. On the one hand, the word used by (e.g.) Euclid to describe irrational lengths (ἄλογος) comes from adding the negative prefix ἄ- to the word for ratio (λόγος). On the other hand, λόγος and ἄλογος had a lot of other meanings.
Ἄλογος could mean unexpected, which would be an appropriate description of the newly-discovered irrational numbers. Or it could mean unspeakable — in the literal sense, although the figurative sense fits with the (possibly fictitious) cover-up by the Pythagoreans. The word could also mean speechless or incapable of reasoning.
It’s fascinating to see how translators (and later mathematicians) decided to resolve the polysemy of ἄλογος:
- Latin translations of Greek works used ratio for λόγος and irrationalis for ἄλογος. These were actually imported into mathematical English before their non-technical meanings.
- Early Arabic mathematicians called a deaf root (جذر أصم) in reference to the “speechless” meaning of ἄλογος. This got translated back to Latin as surd, a now-archaic term for (irreducible) roots.
- In modern Arabic, the phrase is “non-fractional number” (عدد غير كسري).
- In modern Greek, irrational numbers are now called inexpressible (άρρητος).
-
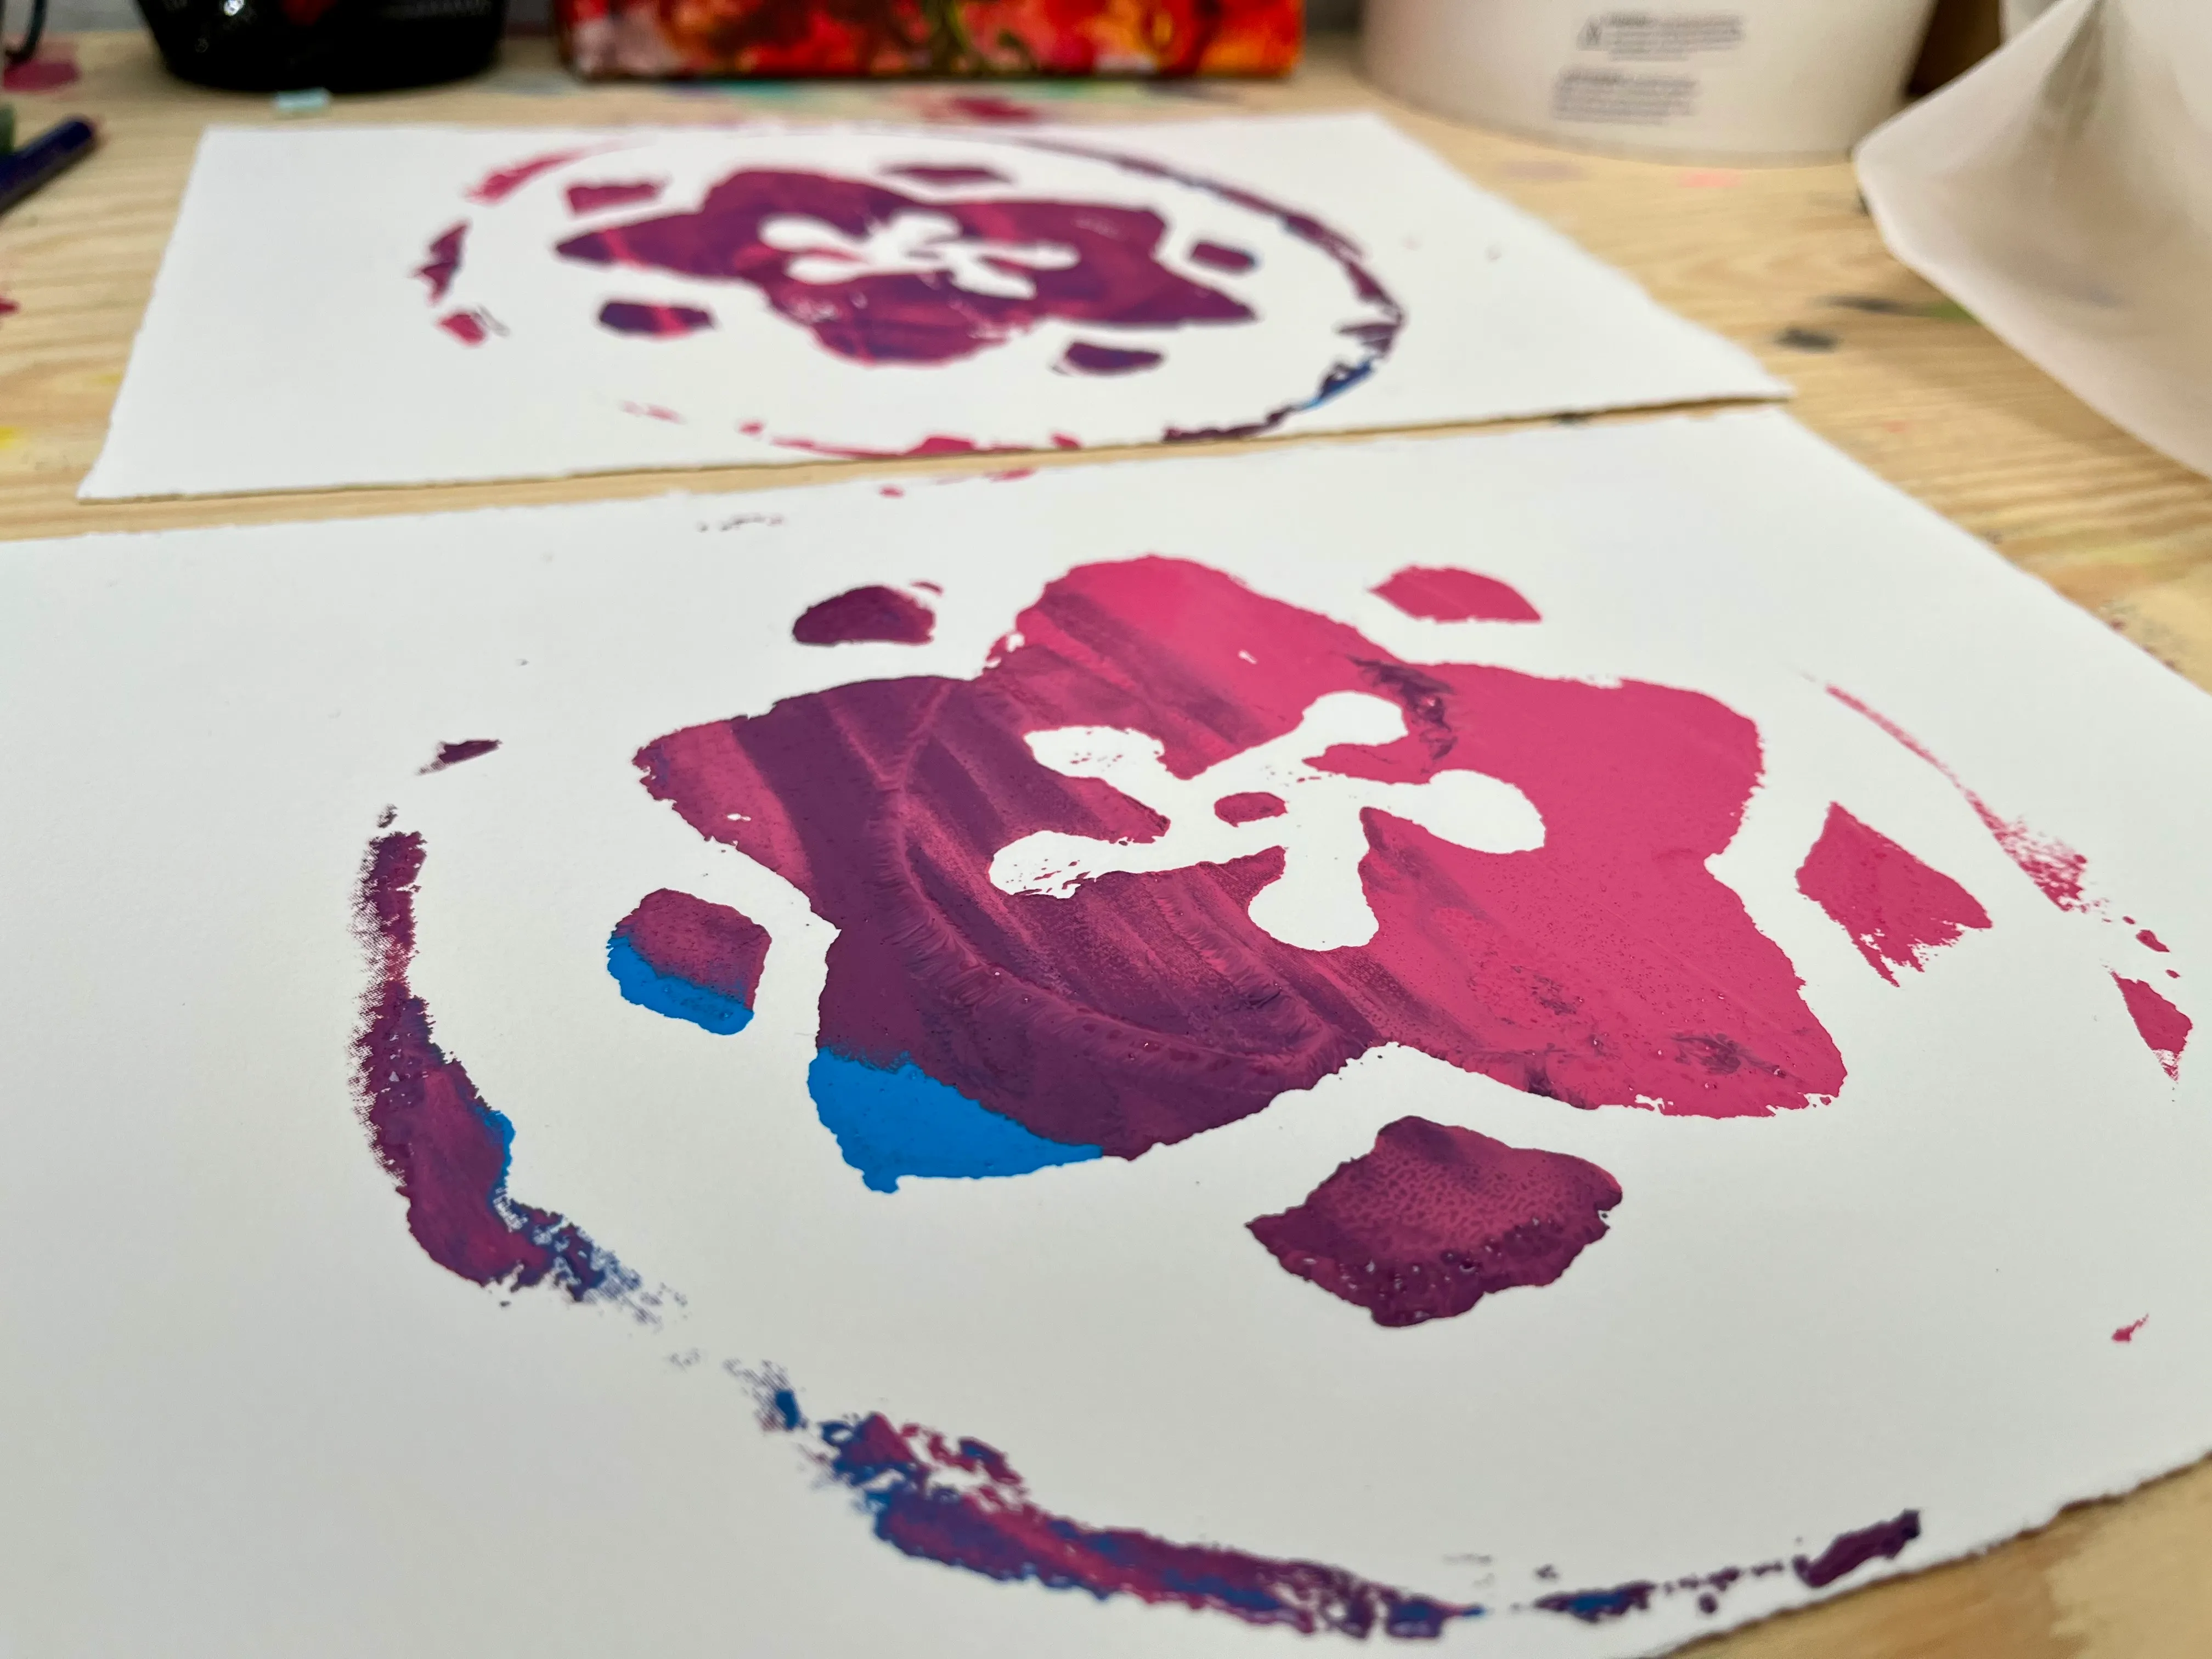
Watercolour: First steps
Unicode calligraphy: Ampersand
Papercraft dragon and koi
Cross-stitch Cetoddle
T.T.T.
Unicode calligraphy: Seat
How to Build RAM
Karakami
Etymology of tea
Mizuhiki
Gee, that's random: Japan edition
Unicode calligraphy: Roman numeral ten thousand
Yuzen
Five o'clock melodies
Unicode calligraphy: Braille 146
Tōkyō
Origami museum
Japan fire infrastructure
Picture of the day
