
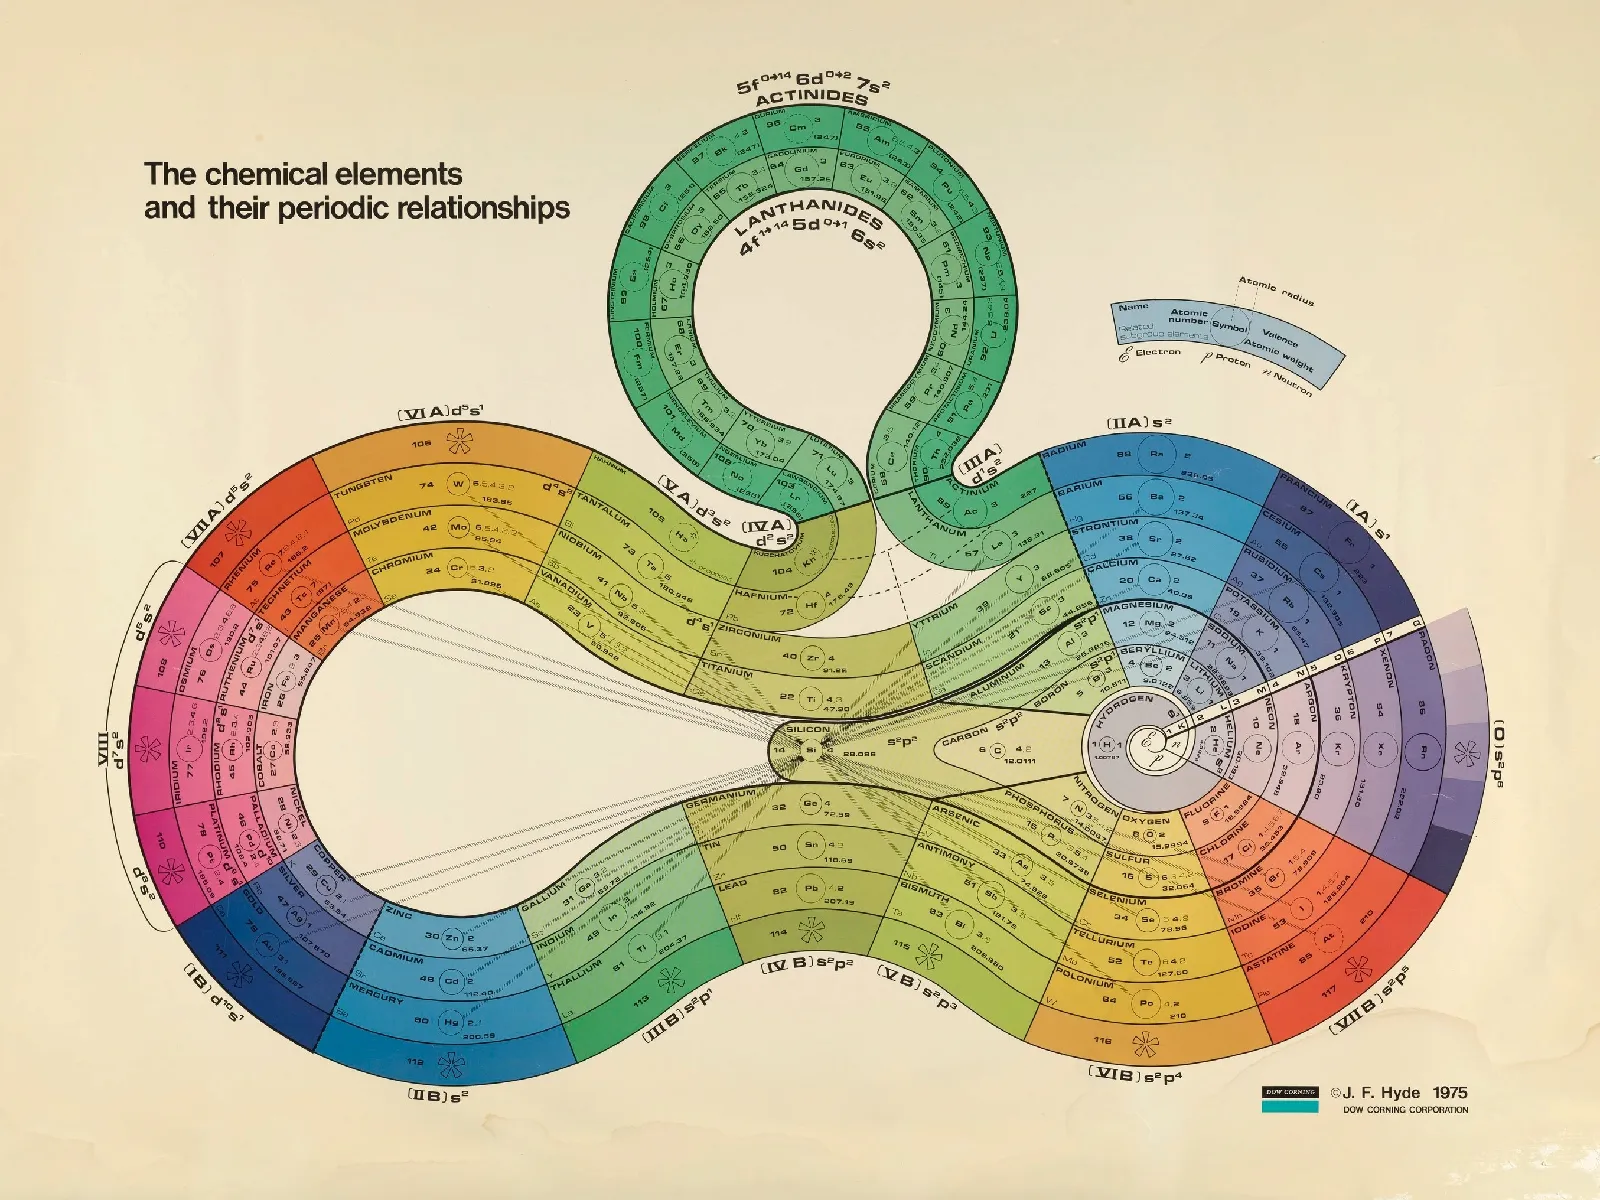
The standard Periodic Table is an iconic data visualization, but it’s not the only way to represent the relationships between elements. This beautiful “ribbon” version was designed by James Hyde in the 1970s.
James Franklin Hyde was a pioneer in the silicone industry, so it’s appropriate that periodic ribbon puts the element silicon in the center and highlights its relationships to the other elements.
Hyde may have been inspired by the spiral chart published by Theodor Benfey in the same journal a few years earlier.
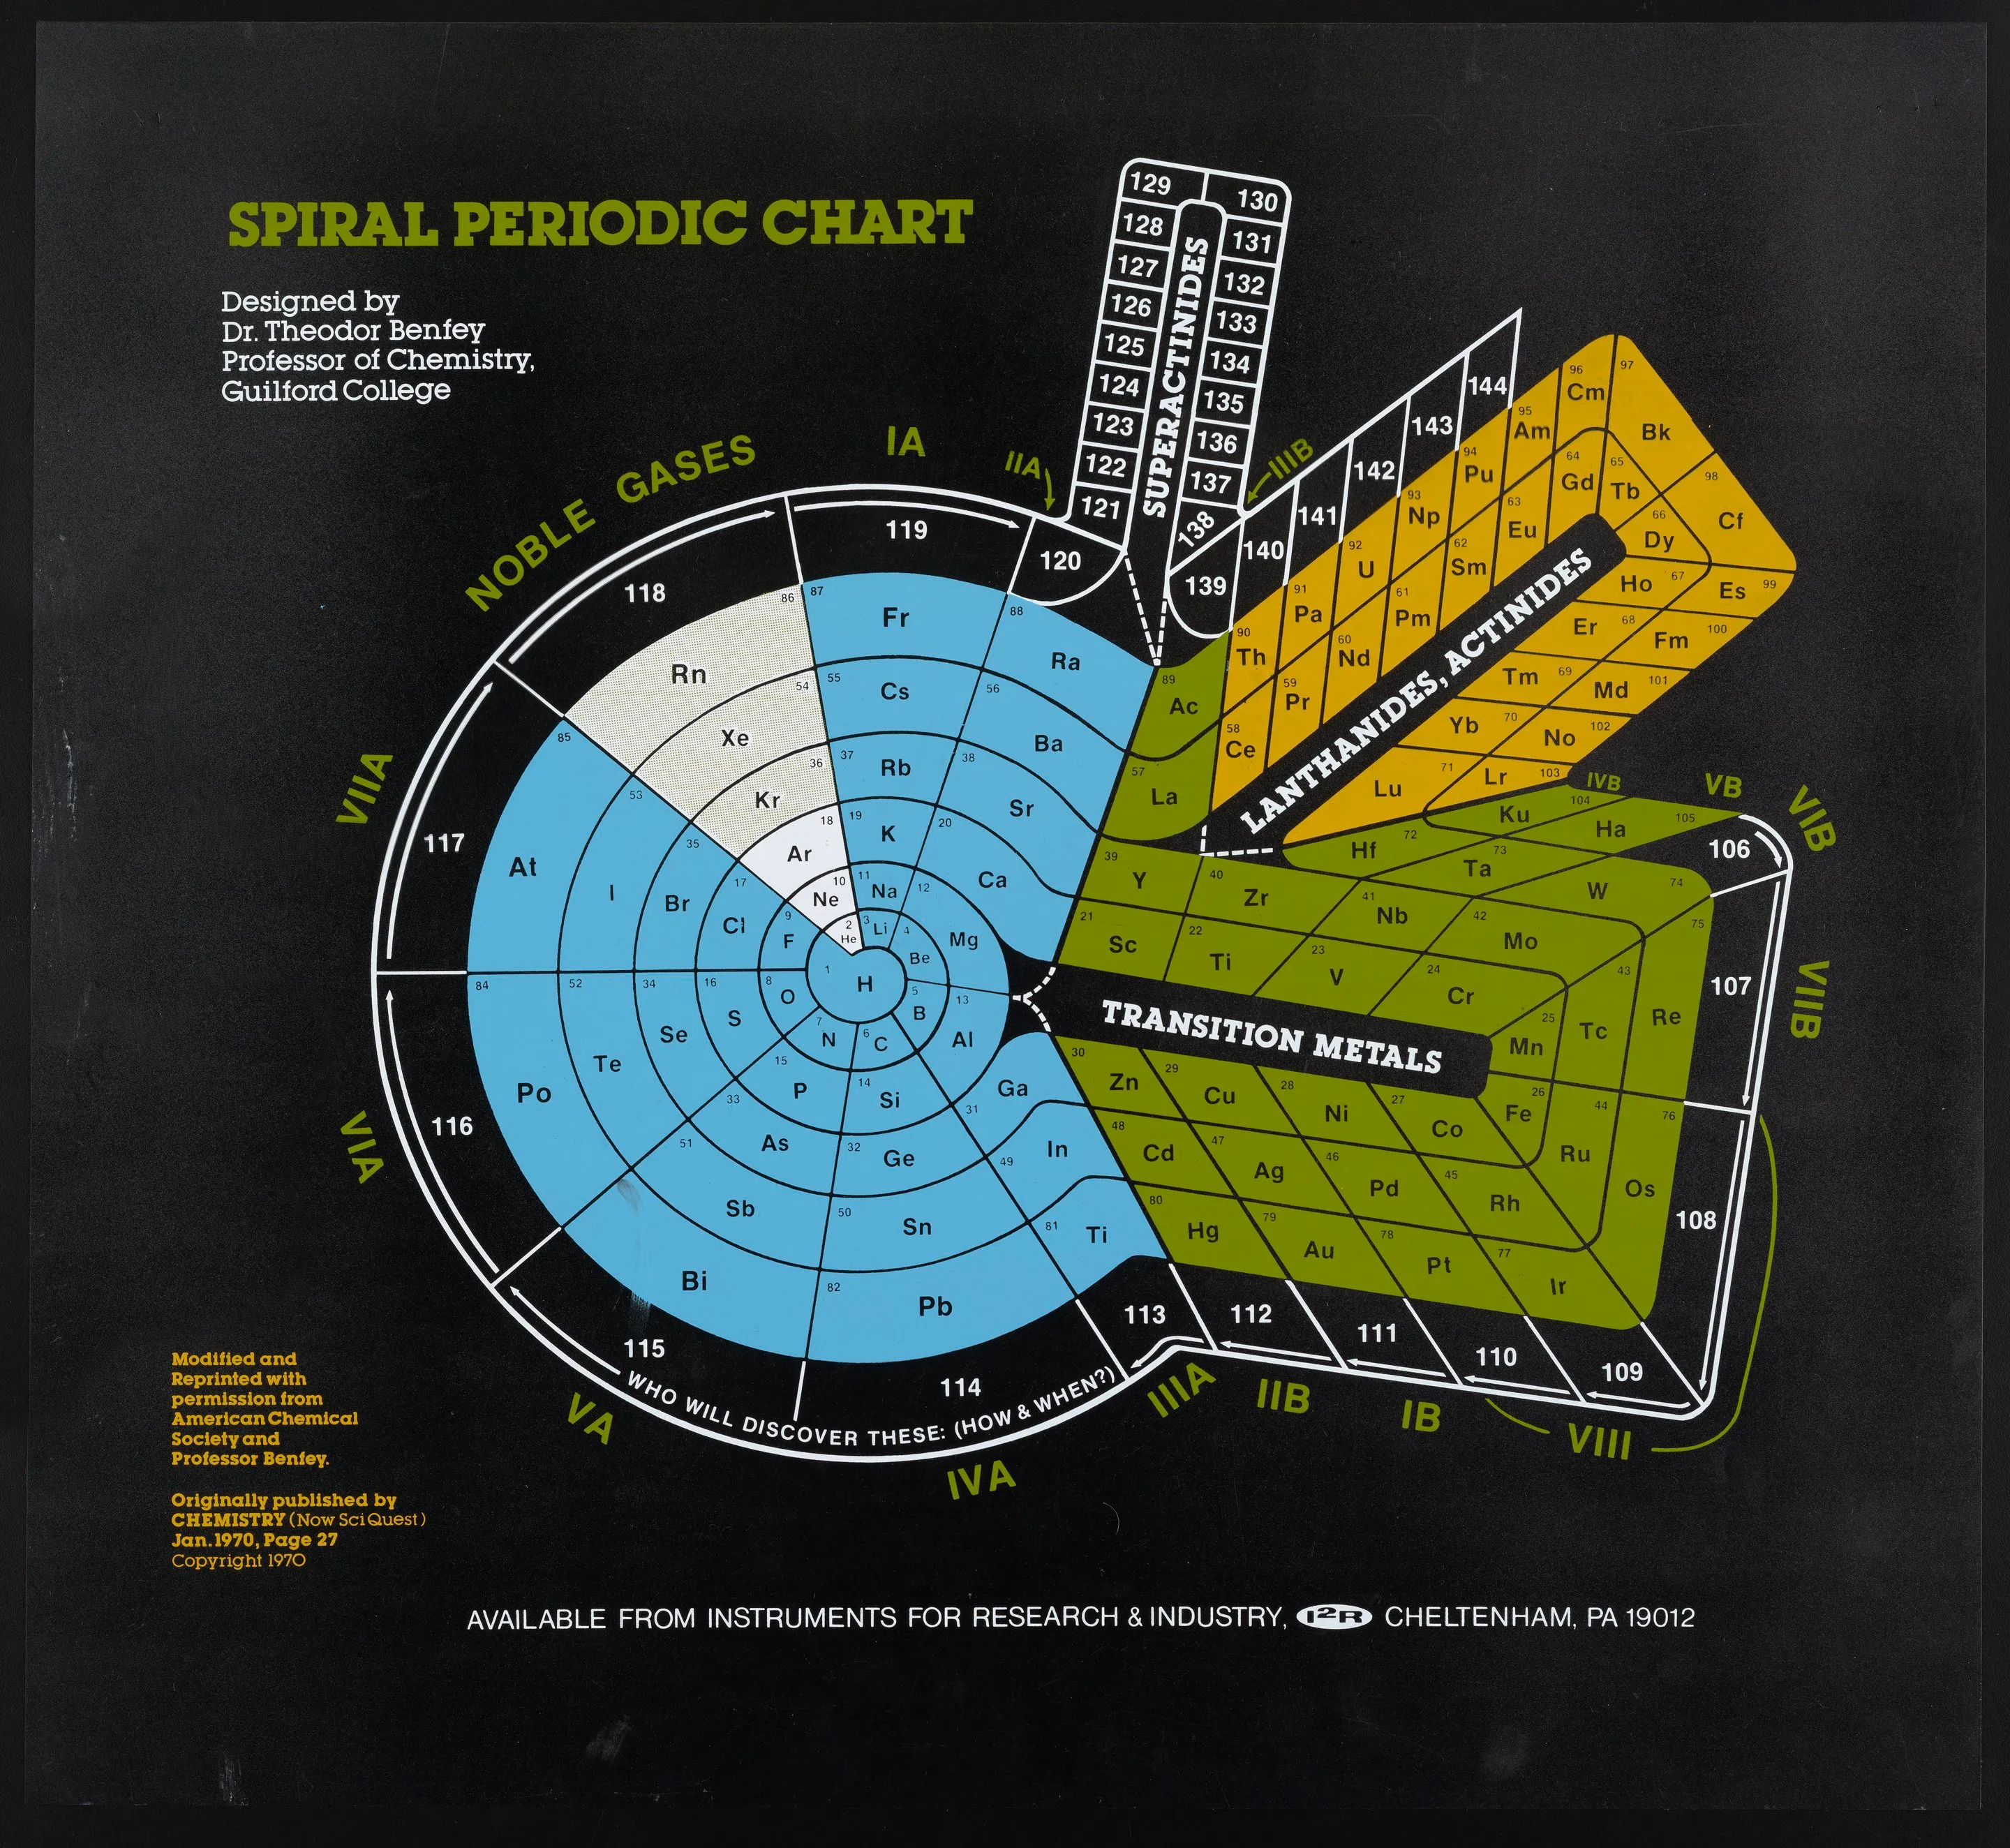
Benfey’s periodic snail of the elements. (Theodor Benfey / Science History Institute)